PropertyDirector
Designed an all-in-one digital ecosystem designed for Australian property investors to consolidate historically fragmented tasks—market research, deal analysis, portfolio forecasting, and digital bookkeeping—into a single, trusted cloud platform.
Kamol
1/8/20263 min read
Objective
To eliminate the reliance on paper records and disparate spreadsheets by providing a "birds-eye" and "granular" view of a property portfolio. The goal is to empower investors with data-driven confidence to evaluate new deals and manage existing assets with 10-year forecasting precision.
Discovery
The discovery phase identifies three primary archetypes:
The Aspiring Accumulator: Looking for the next deal, rely heavily on the Deal Analyser and Market Activity Reports to ensure they don't make a $500k mistake.
The Portfolio Planner: Already owns 2–5 properties. They use the Portfolio Forecaster to visualise their wealth 10 years out and decide when they can afford to "buy again" or "retire."
The Organised Landlord: Focused on the "now." They use Digital Bookkeeping to eliminate paper trails and stay tax-ready year-round for unlimited properties.
Pains
Data Fragmentation: Using one site for research, another for bank feeds, and a spreadsheet for forecasting.
The "Crystal Ball" Problem: Difficulty predicting how a current purchase affects long-term wealth without complex manual math.
Audit Anxiety: Fear of losing physical receipts or records required for capital gains tax or annual returns.
Analysis Paralysis: Overwhelming amounts of suburb data that are hard to synthesise into a "Buy/No-Buy" decision.
Hypothesis
H1 (The One-Stop Shop): If we centralise bookkeeping and research in one login, then user retention will increase because the platform becomes an essential daily utility rather than a monthly research tool.
H2 (Data-Driven Confidence): By using 30 years of historical suburb data for the Portfolio Forecaster, we can reduce investor anxiety and increase "deal-flow" through the platform.
H3 (Accessibility of Insights): If we provide both "Bird's Eye" and "Detailed" reporting, we can satisfy both the high-level strategist and the detail-oriented accountant.
Journeys
The investor journey within the platform follows a cyclical path:
Research: Using Market Activity Reports to find a suburb.
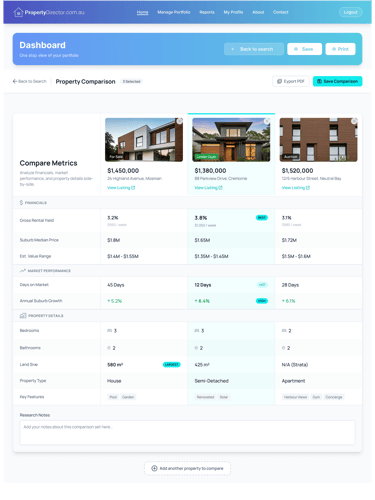
Evaluate: Running a "Deal Analyser" report on a specific address.
Acquire: Adding the new asset to the Digital Bookkeeping system.
Monitor: Tracking monthly cash flow and expenses.
Forecast: Checking the 10-year Portfolio Forecaster to plan the next move.
Sitemap
The architecture is structured around four pillars:
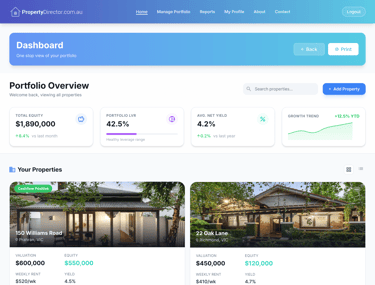
Dashboard: High-level portfolio value and cash flow summary.
Research Hub: Suburb research, market activity, and "Deal Analyser" tools.
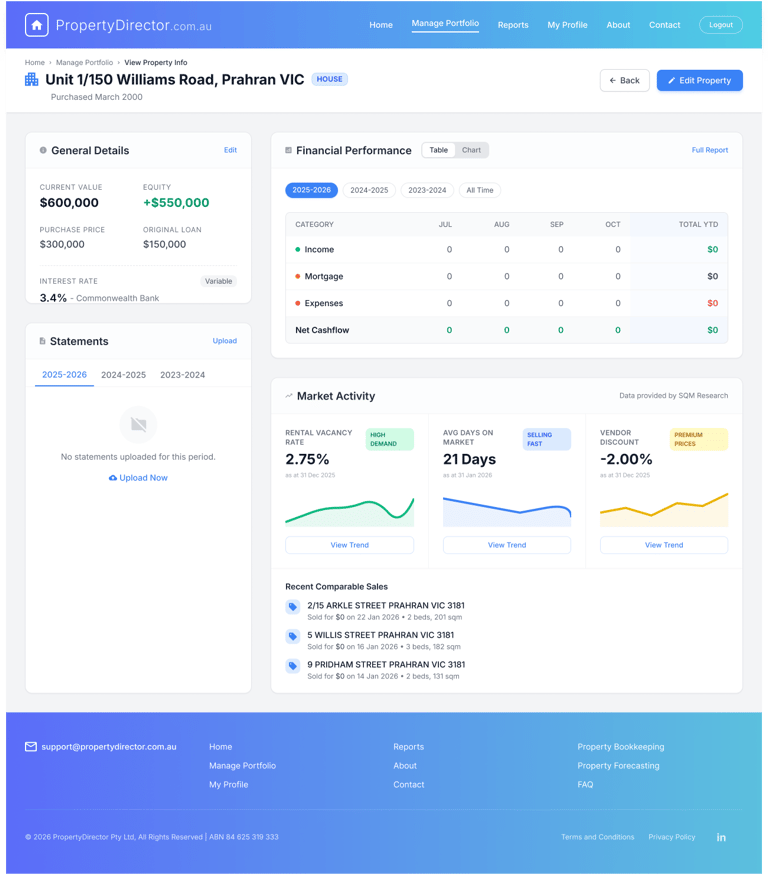
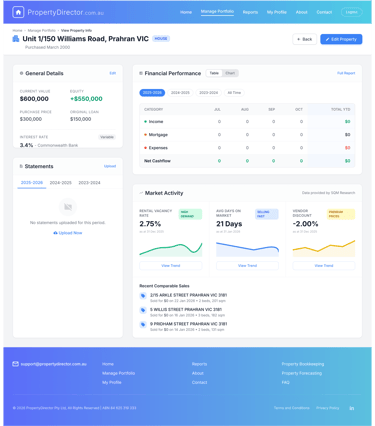
Portfolio Manager: Property-specific folders, document storage, and bookkeeping.
Reporting Suite: 10-year growth projections and tax-ready financial statements.
Design Approach
Discovery focuses on a Mobile-Responsive Interface:
Forecasting View: A clean line chart showing projected value over 10 years with a "historical data" toggle.
Bookkeeping Interface: A "Quick-Add" transaction button and a document upload zone that mimics a digital filing cabinet.
Test Results
Qualitative: User interviews with "Spreadsheet Power Users" to see if the Digital Bookkeeping replaces their manual workflows.
Quantitative: "Time-to-Task" testing—how long does it take a user to generate a 10-year forecast compared to manual methods?
Conversion Metrics
Trial-to-Paid Ratio: Investors moving from free suburb searches to full portfolio management.
Report Generation: Number of "Deal Analyser" reports run per user (a lead indicator of active investing).
Document Upload Volume: Measuring the "stickiness" of the digital vault.
Success Evidence
User Retention: % of investors who log in during tax season (July–October).
Forecast Accuracy: Alignment of platform projections with actual market growth over 12-month cycles.
Net Promoter Score (NPS): Likely high if the platform successfully "eliminates the need for paper records."